
In our digitized era, data presentation and visualization have become increasingly important for everyone, from businesses and researchers to academics. One useful tool for data representation is combination charts, where multiple data sets are visualized using different chart types. In this article, we’ll delve into the types of combination charts and their uses. Keep reading to gain a stronger understanding of these versatile tools.
Exploring Combination Charts: A Deeper Dive Into Data Visualization Basics
Alt text: A dark background screen showing different types of charts and data.
Jointly representing different types of data can be challenging. Single charts might be useful in visualizing one data set, but struggles arise when attempting to classify multiple sets of data together. This is where combination charts come into play. They offer the flexibility of showing multiple data sets in a single graph, which would have otherwise required two separate visualization tools.
They provide a detailed overview of complex data sets and help identify relationships between metrics. As a result, charts and graphs have become an integral part of any reporting, forecasting, or analyzing systems where data visualization is key.
Combining charts can effectively clarify trends, discrepancies, and correlations in data and accentuate how individual elements contribute to the sum of a whole. They provide a multi-layered data perspective, making data consumption more digestible.
Essentially, combination charts serve a great purpose in drilling down complex data, translating raw numbers into understandable insights, and making data-driven decision-making easier and more efficient.
Understanding Different Types of Combination Charts
While combination charts, in general, are highly effective, the specific type of chart used often depends on the nature of the data presented. The popular types include column-line, line-area, and more.
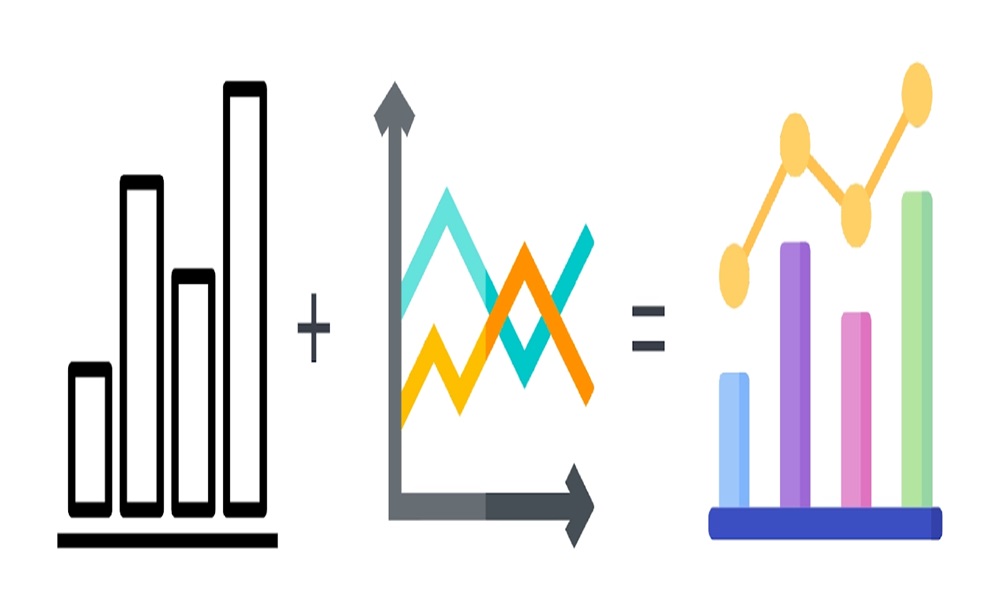
The column-line chart, for example, utilizes both a line graph and a column chart to illustrate different types of data attributes. The line tracks the trend over time, while the bars measure precise values at specific intervals.
On the other hand, line-area charts highlight the disparity between two data series and visually capture the difference between them. This type of chart can be insightful when comparing two correlated metrics.
Choosing the right combination chart often requires a clear understanding of what you need to accurately represent the data while keeping the visual presentation simple and effective.
Charts in Action: Case Studies of Effective Combination Charts
It’s beneficial to delve into some case studies to understand the real-world application of combination charts. For example, charts have been used effectively to represent temperature variations and rainfall data over a period.
In another case, a business firm used a column-line chart to analyze the impact of advertising expenditure on a product’s sales. The column bars represented the advertising costs, whereas the line depicted the sales. This helped the company visualize the connection between sales and advertising spending.
Another study used line-area charts to illustrate income disparity among different demographic groups. A clear visualization of such data sparked conversations around income inequality and proposed potential solutions.
Choosing the Right Combination Chart: Guidelines for Optimal Data Presentation
Alt text: Two versions of types of combination charts beside one another.
The role of combination charts in data visualization is undeniably significant. However, choosing the right chart type is equally important for conveying accurate information. Various factors must be considered, such as the data’s characteristics, the number of variables, and the story the data intends to tell.
Furthermore, it’s important to keep the chart simple and not overload it with too much information. A cluttered chart can complicate instead of simplifying the data comprehension process.
It’s also necessary to keep your audience in mind while developing the chart. A clear, easy-to-understand chart will ensure that anyone looking at it can quickly grasp its information.
Combination charts offer a multifaceted solution for visual data representation. Understanding their types, applications, and the right usage guidelines can significantly improve how we present and interpret complex data sets. The power of the combination charts lies in their capacity to turn raw data into accessible, actionable insights.


Comments